
Slow Pass synthesis involves combining audio rate modulation with very slow-moving modulation sources. For example, we might FM modulate one oscillator with another at audio rates while simultaneously feeding tiny fluctuations in voltage to the pitch of one of the oscillators (the slow pass CV).
This broad technique is likely as old as synthesis itself. The purpose of this essay is to name the technique and expand on its technical and philosophical significance.
I find myself drawn to Slow Pass synthesis for several reasons. I want to know all the intricacies of the synth circuitry that I’m working with. Slow Pass synthesis gives me the means to hear aspects of the synth circuitry that I would not be able to hear in any other way. Slow Pass synthesis is a way to systematically explore and play the instabilities inherent in audio rate modulation of synth parameters. Slow Pass synthesis also allows us to work with signals and modulation sources that would otherwise be moving too slowly to be discernible.
The Atmospheric Tide as a Modulation Source
Barometric pressure sensors can detect changes in the weight of the earth’s atmosphere. These changes in air pressure come from two main sources. The weather, and changes that are associated with the cyclic heating of the planet by the sun over the course of the day. This second category of air pressure changes is called the atmospheric tide.
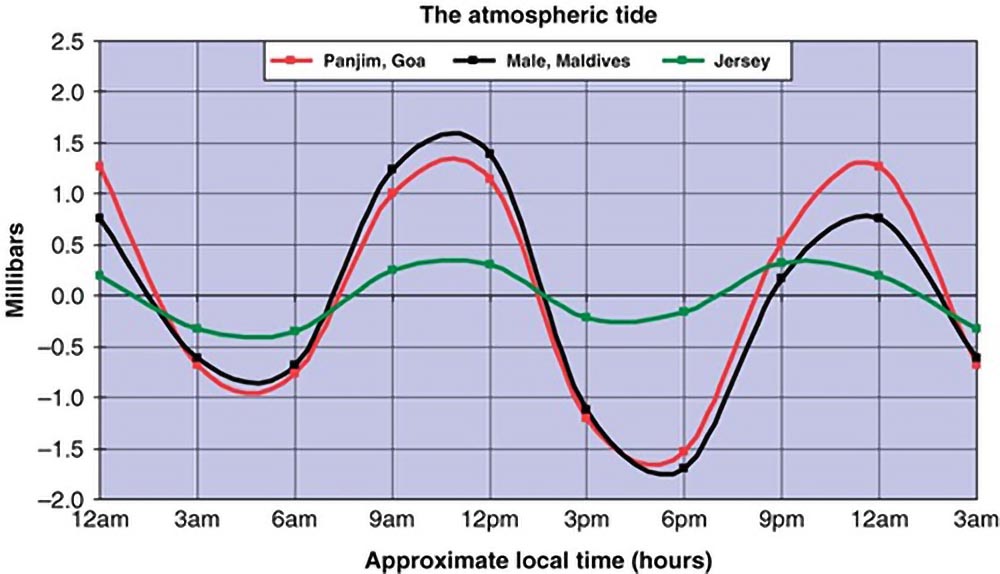
When we remove the “noise” of the weather and plot the atmospheric tide on a graph we can see that it is a sine wave with a 12 hour cycle. The amplitude of this sine wave is greatest at the equator (see below). There it is also less likely to be swamped by the “noise” of the weather. Further from the equator the sine wave of the atmospheric tide is still discernible, over longer periods of time, in graphs of air pressure.
Slow Pass synthesis is a technique that allows us to listen to the atmospheric tide. I’ve been using audio rate Pulse Width Modulation (PWM) combined with an analogue barometric pressure sensor to do this kind of listening. When the oscillator that is modulating PWM is close to being in tune with the main oscillator we hear a beating pattern. If we gradually change the frequency of the modulating oscillator with a barometric pressure sensor we can relate changes in air pressure to changes in the beat frequency created between the two oscillators.
These technical details are for my fellow synth nerds. Suffice to say that this is an interaction between two oscillating waves that is similar to the beating that occurs when you have two notes that are very slightly out of tune with one another.
However, you don’t need to know any of this to attune yourself to changes in atmospheric pressure. You can do that by listening to the following recording. Simply listen for rhythmical and timbral changes. These are being caused by the atmospheric tide.
On the left of this graph you can see the changes in atmospheric pressure that correspond with the time of this recording (6:00-10:00pm Saturday 20 May, 2023). The dots are spaced at one hour intervals.
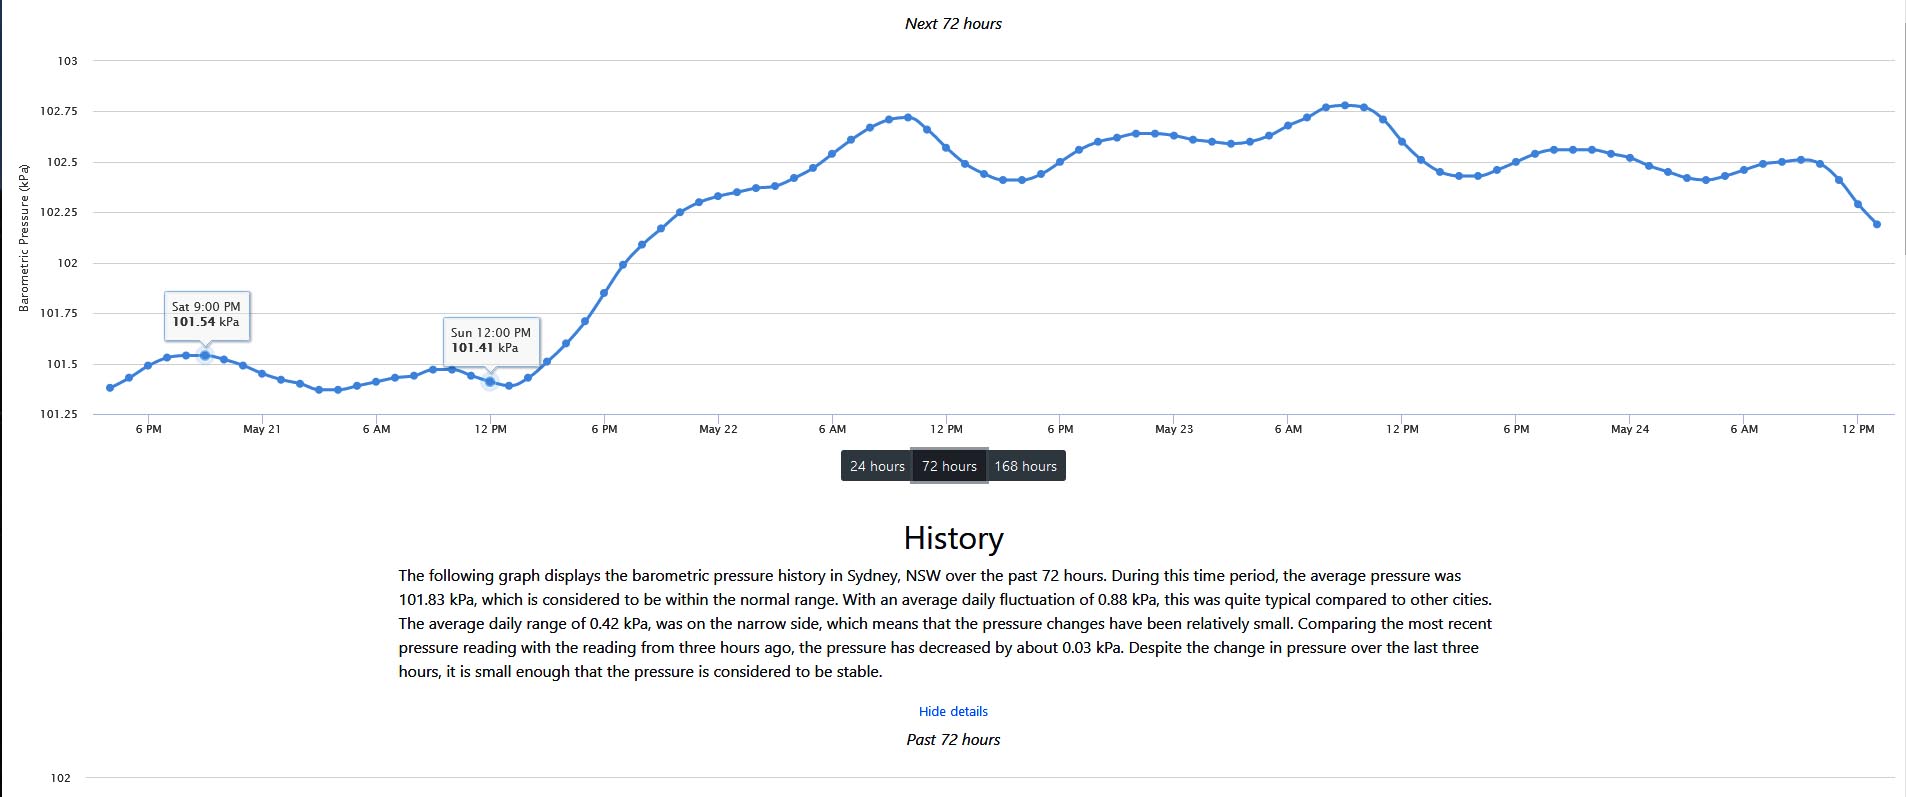
At 9:00 PM on Saturday 20 May 2023 the atmospheric pressure in Sydney was 101.54 kilopascals. 9:00 PM is roughly three hours in to the recording posted above. You can also see the signature of the atmospheric tide in this part of the graph. When we remove the fluctuations of weather, we would expect to see the peak of the sine wave at 10:00 AM and 10:00 PM and the trough at 4:00 AM and 4:00 PM. This corresponds quite closely to what you see up until 12:00 PM on Sunday 21 May. Around 1:00 PM we see a steady rise in air pressure that swamps the signal of the atmospheric tide.
The video above [all four hours of it] is a trailer for the actual work; experiencing the changes in barometric pressure in real-time. As we listen to these changes in real-time we might reflect more acutely on the relationship between barometric pressure and those changes that we can more easily sense in our immediate surroundings (wind, temperature, time of day, etc.). We might also reflect on the way that anthropogenic climate disruption is changing the very signal that we are listening to. The work encourages us to reflect on the relationship between the atmosphere in our immediate locale and the earth’s atmosphere as a whole.
Slow is how we do
I end this post with a shout-out to Andrew Fitch of Nonlinearcircuits fame. Andrew lives in Perth, roughly 3290kms from where I am now, on the other side of the Australian continent. Andrew makes chaos circuits, in the form of synth modules, including the four sloth variants. These are beautiful, slow, modulation sources, (a heavily attenuated sloth would make an excellent Slow Pass modulation source). I like slow modulation sources because I am slow. It has taken me two years of working with synthesizers to realise the importance of slow to what I’m doing, two years to buy one of Andrew’s modules!
I do my best thinking slowly. I reckon this is partly because slow is the pace of this continent, and when we do things slowly we better attune ourselves to our surroundings and to the thinking that the ecosystems of this continent have been doing for millions and, in some cases, billions of years.
Stromatolites
Yes, billions. Around 823km to the north of Perth is the town of Denham (the biggest town in Shark Bay). Also in Shark Bay: living stromatolites. Bacterial ecosystems present on this planet for billions of years. I wrote about them in an essay for the Sydney Review of Books.
These structures, created by the aggregation of sediments by communities of microbes, initially in marine environments, appear in the fossil record something like 3.7 billion years ago (the exact dates are a matter of conjecture).
In Shark Bay, Western Australia, living stromatolites continue to aggregate material and build their structure only a metaphorical stone’s throw from the Pilbarra region where wanderers can find 3.4 billion-year-old stromatolite fossils. The ancient stromatolites are similar in many ways to their contemporary counterparts. These similarities have been used to demonstrate that fossil stromatolites from the Pilbarra are not just oddly stratified rock layers. If we think of stable microbial communities as an organism then nothing comes close to matching their longevity in the fossil record.
Me from Forest City
An organism that hasn’t changed much in 3.4 billion years? Slow is how we do. A continent that is home to some of the oldest rocks in existence on this planet? Slow is how we do.
This continent is also home to the true owners of the land on which I write, Aboriginal and Torres Strait Islander cultures, the oldest continuing living culture in the entire world, culture that understands the slowness of this continent in ways that I can never fully comprehend.
What I do know is that knowledge of slow runs deep here. And so I pay my respects to the elders of this land, past and present (and past as presence), I pay my respects to their knowledge of slow.
This is the companion essay to “Where’s the Keyboard?” Synth/Voice – Synthesiser as Audible Voltage Sensor
This project has been supported by the Australian Government through the Australia Council, its arts funding and advisory body.